Chart.js with Django using Ajax
Transfer Data Between JavaScript and Django
In this example, we will transfer data between Django and JavaScript and dynamically update a chart in the browser.
We will use:
Django for the backend,
Ajax for asynchronous communication between the browser and the server,
and Chart.js for visualizing the returned data.
The example is intentionally simple so that we can focus on the data flow between the frontend and Django.
The code is available in the ajax_charjs (opens in a new tab) app.
AJAX stands for Asynchronous JavaScript and XML.
Despite the name, Ajax does not require XML. Modern applications commonly exchange data in formats such as JSON.
Ajax allows JavaScript running in the browser to communicate with a web server asynchronously. This means that the browser can send a request, receive a response, and update part of the page without reloading the entire document.
In this example, we use jQuery's $.ajax() function to send requests from the page to Django.
The general flow is:
User Input ↓Ajax Request ↓Django View ↓Server-Side Processing ↓JSON Response ↓JavaScript ↓Chart.js UpdateThis application takes a value from the user, sends it to Django, processes it on the server, and then updates the chart with the returned result.
JavaScript reads the user's input and sends it to the Django view using an Ajax request.
The Django view then processes the value according to the application logic. To keep the example simple, we will only add 10 to the input value.
Finally, Django returns the processed value to the browser as JSON. JavaScript receives the response and adds the new value to the Chart.js dataset.
The chart is then updated dynamically without refreshing the page.
We have only one application in this project. Let's name it ajax_charjs.
We also have one page, index.html, and one Django view class.
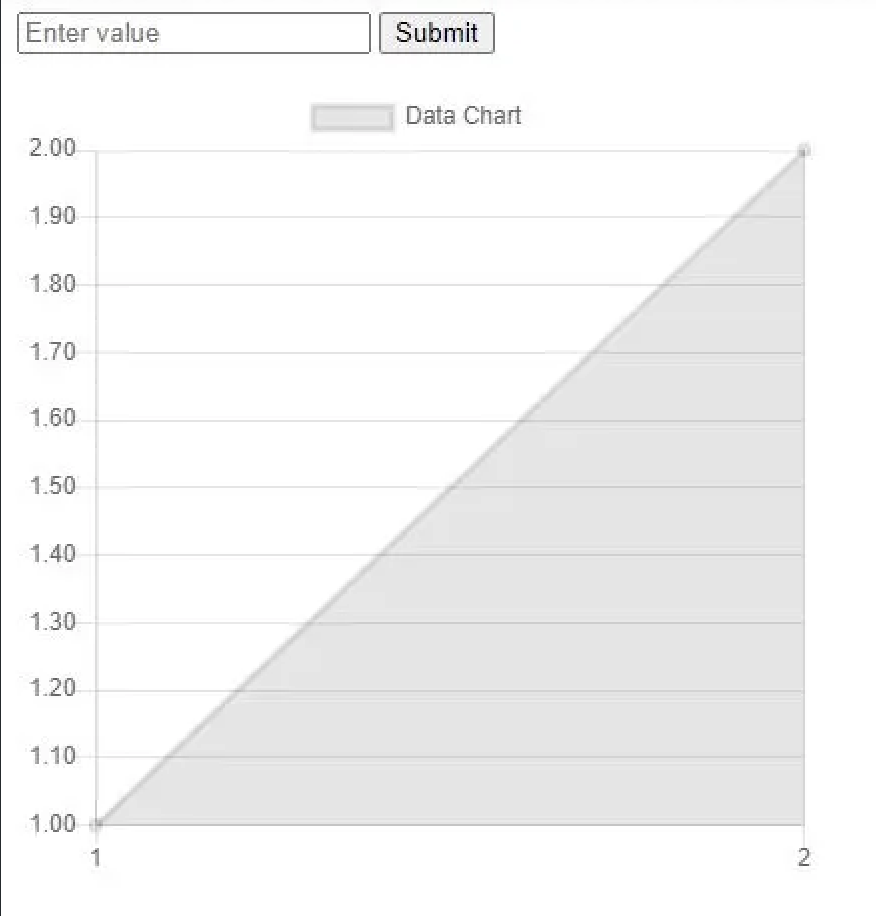
Chart.js uses an HTML <canvas> element to render the chart.
<canvas id="myChart" width="400" height="400"></canvas>const ctx = document.getElementById('myChart').getContext('2d'); const myChart = new Chart(ctx, { type: 'line', data: { labels: [1, 2], // dummy initial labels datasets: [{ label: 'Data Chart', data: [1, 2], // dummy initial data }] }, options: { responsive: false // to define specific size }});Here, we first get the two-dimensional rendering context of the canvas and use it to create a Chart.js chart.
The chart starts with dummy labels and data:
labels: [1, 2]data: [1, 2]These values only provide an initial state for the chart. Later, new values returned by Django will be appended dynamically.
The myChart object is important because we will use it later to modify the dataset and redraw the chart.
Now we can send the value entered by the user to Django.
$('#submit').click(function (e) { e.preventDefault(); $.ajax({ url: '', type: 'GET', data: { val: $('#value-field').val() }, success: function (response) { myChart.data.datasets[0].data.push(response.data); myChart.data.labels.push(myChart.data.labels.at(-1) + 1); myChart.update(); } });});When the user clicks the submit button, the value in value-field is read:
$('#value-field').val()It is then sent to Django using a query parameter called val.
For example, if the user enters:
20the request will contain a parameter similar to:
?val=20The request uses GET because this simple example only sends a value to the server and receives a calculated result. It does not create or modify persistent server-side data.
The empty URL:
url: ''means that the Ajax request is sent to the current page URL.
For a small demonstration like this, this keeps the example simple.
On the Django side, the view receives the value sent by the Ajax request.
from curses.ascii import HTfrom django.http import HttpRequestfrom django.shortcuts import renderfrom django.http.request import HttpRequestfrom django.views.generic import Viewfrom django.http import JsonResponseclass AjaxViewer(View): def get(self,request:HttpRequest): if request.GET.get('val'): value = float(request.GET.get('val')) #get data from ajax value += 10 #dummy process return JsonResponse({'data':value},status=200) #return json response return render(request,'./templates/ajax_chartjs/index.html') def post(self,request:HttpRequest): return render(request,'./templates/ajax_chartjs/index.html')When the page is opened normally, the request does not contain val, so Django renders the HTML page.
When the Ajax request contains val, Django retrieves it using:
request.GET.get('val')Values received through query parameters arrive as strings, so the value is converted to a floating-point number:
float(request.GET.get('val'))For this example, the server-side processing is intentionally simple:
value += 10In a real application, this step could represent more meaningful server-side logic such as calculations, database queries, aggregations, or other domain-specific operations.
After processing the value, Django returns it as JSON:
JsonResponse({'data':value},status=200)For example, if the user sends:
20Django returns a response equivalent to:
{ "data": 30.0}This example assumes that the user enters a numeric value. In a production application, the input should also be validated so that invalid values can be handled safely.
When Django successfully returns the response, the Ajax success function is executed.
success: function (response) { myChart.data.datasets[0].data.push(response.data); myChart.data.labels.push(myChart.data.labels.at(-1) + 1); myChart.update();}The returned value is first added to the chart's dataset:
myChart.data.datasets[0].data.push(response.data);Then a new label is added:
myChart.data.labels.push(myChart.data.labels.at(-1) + 1);Finally, we call:
myChart.update()This tells Chart.js to redraw the chart using the updated data.
The complete interaction therefore looks like this:
User enters a value ↓JavaScript sends the value with Ajax ↓Django receives the value ↓Django processes the value ↓Django returns JSON ↓JavaScript receives the response ↓The new value is added to Chart.js ↓The chart is redrawnThis example demonstrates a simple way to connect a Django backend with a dynamic frontend.
Each part has a different responsibility:
Django receives and processes the data.
Ajax enables asynchronous communication between the browser and Django.
JSON carries the processed value back to the browser.
Chart.js visualizes the returned data.
Although this example uses jQuery's $.ajax() function, the important concept is the request-response flow itself.
The same pattern can be used whenever data needs to be processed on the server and reflected in the user interface without reloading the entire page.
By combining Django, Ajax, and Chart.js, we can build interfaces where server-side data is reflected dynamically in charts and other frontend components.
Check your understanding
Take a moment to revisit what you learned. Choose one answer for each question. Anonymous results help improve this article.
Key terms
| Term | What people say | What it actually means |
|---|---|---|
| Ajax | Talking to the backend | An asynchronous browser request that exchanges data with the server without reloading the whole page. |
| Django view | The backend logic | A request handler that reads the input, processes it, and returns a response. Here, it converts val to a number and adds 10. |
| JsonResponse | Sending data back | A Django response that serializes the result as JSON. JavaScript receives the returned value through response.data. |
| Dataset | The chart's numbers | A collection of plotted values and their display settings. This example appends the result to myChart.data.datasets[0].data. |
| Chart update | Refreshing the chart | Calling myChart.update() redraws the canvas after the dataset and labels change. The rest of the page stays in place. |